Here’s the very basic outline of what GIS (Geographic Information Systems) could do for Oak Park, in the context of a city-wide program.
The program is broadly divided into 3 levels – city, district / neighborhood, and project.
Program Description
City:
At the city scale, government is concerned with higher-level objectives in support of master plans / climate plans, and providing downstream levels the guidance, data, and resources necessary to achieve their district level objectives.
At this level, program administrators would handle provision of remote sensing data for high-level analysis, plus dissemination of remote-sensing-derived analytic summaries to the low-lying districts. They would receive project-to-neighborhood rollup summaries of the effects of various initiatives.
District / Neighborhood:
At the district and neighborhood scale, community and local non-profits would strive to achieve objectives feeding the overall city priotities. Each district or neighborhood would also set their own priorities for improvements in specific areas, driven by finer-grained remote sensing data, such as that provided by Aclima and project-site air sensors.
Project:
At the project level, GIS provides organizations and volunteers with the ability to more easily execute new projects and maintain their existing ones. They’d be able to engage volunteers more effectively and have the benefits of remote sensing data.
The upshot of all this is that at every level you’re able to track the resources being put into solving issues and be able to track the impact of said efforts.
Software Package Used
- ArcGIS
- ArcGIS Online
- Voting System
- Aggregate Summaries
- Data Submission
- Geotagged Form (Survey123)
- Program Signup
- House Improvements: link to SMUD account for quick savings estimate
- Yard garden: Calculate your subsidy
- ArcGIS Server
- Localized remote sensing data
- RGB
- Multispectral
- Raster calculations
- Air Quality Sensors
- Usage metrics
- Energy
- Water
- Localized remote sensing data
- Desktop client
- Use by consultants to design stuff
- Pull data from server for monitoring
- Metrics visualization + promotion
- ArcGIS Online
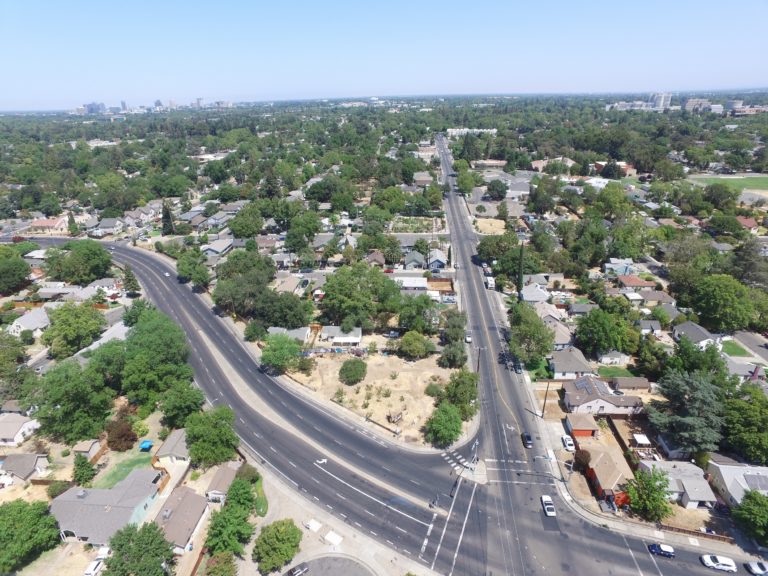
Here are some sick greening visuals – all vacant parcels become community ecological reserves. Obviously the sites will not be entirely green, but it illustrates the obvious potential for rapid expansion of ecological reserves.
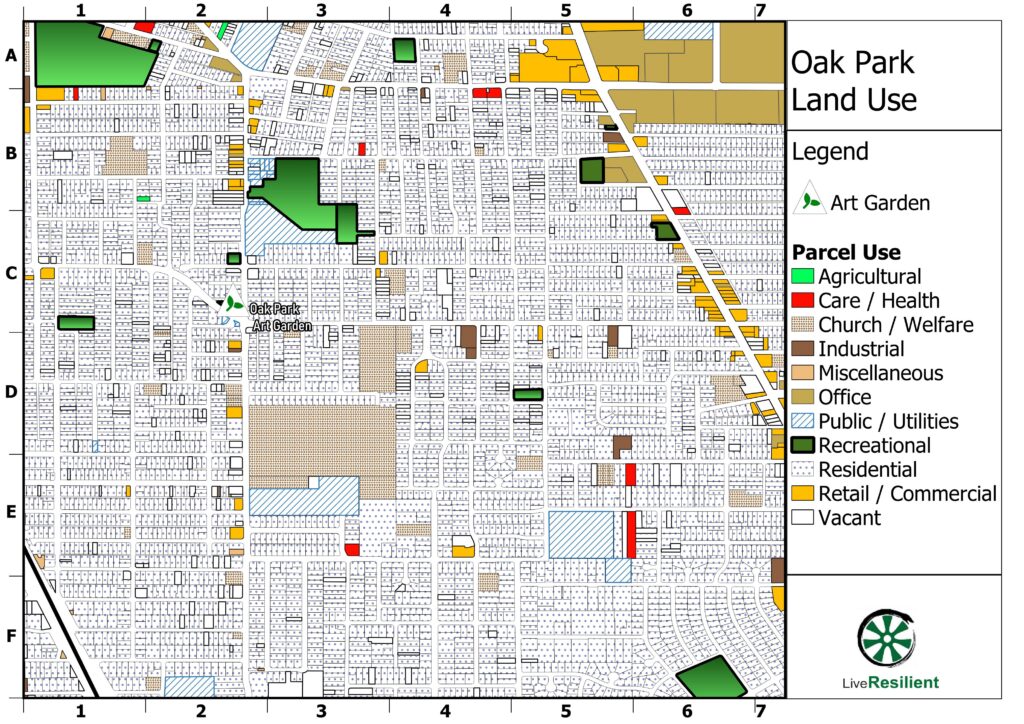
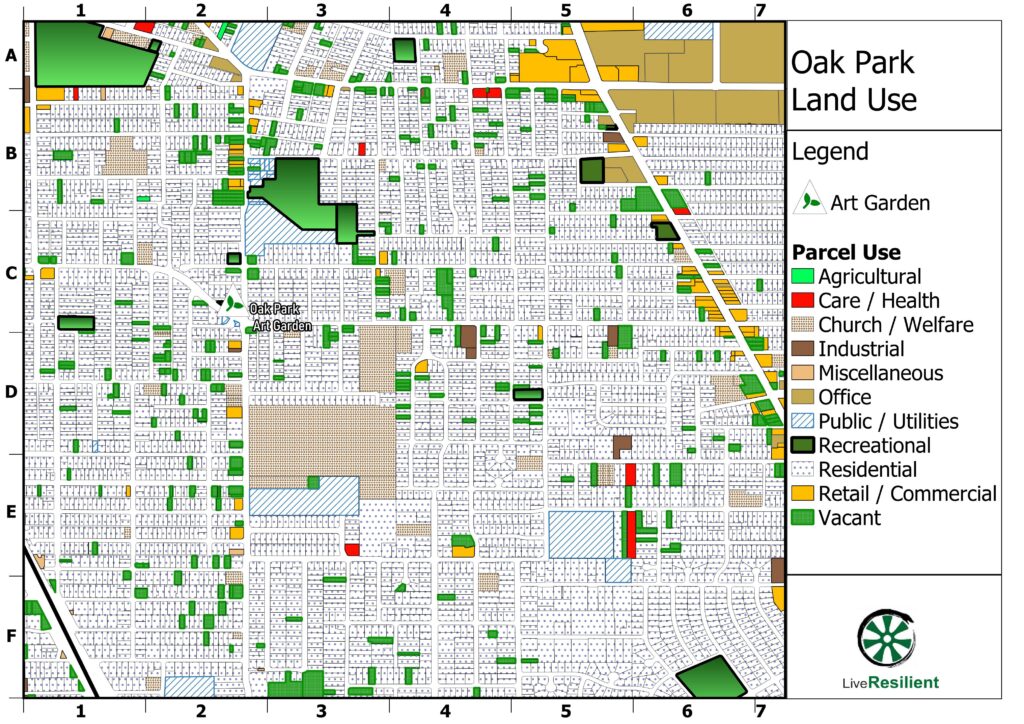
I would wager this is a land ratio of vacants a bit higher than the normal area, but you can always find a way. Maybe knock down a few buildings or parking structures if you have to really grow food!
